
Athlete analysis
Two views answer two different questions. The athlete’s own Performance tab answers how is this archer going? Talent ID answers who should we be looking at? Both are built from competition results the platform already holds.
One athlete
Section titled “One athlete”Open an athlete under Archery → Athletes and pick the Performance tab. It is the one part of the suite a club-scope coach can reach for their own athletes; everything else in this section is federation-wide.
A Lens sits at the top of the tab and scopes the two panels under it: a bow type, and Indoor & outdoor, Indoor or Outdoor. Leaving it on All bows and Indoor & outdoor is fine for an archer who shoots one bow at one distance, and misleading for one who does not — 18m and 70m arrows are never averaged together, but a mixed lens will still draw them on the same chart.
Two buttons beside it take the athlete away with you: Export dossier (PDF) produces a readable summary in the language you are using, and Export CSV gives you their raw qualification history.
Progression
Section titled “Progression”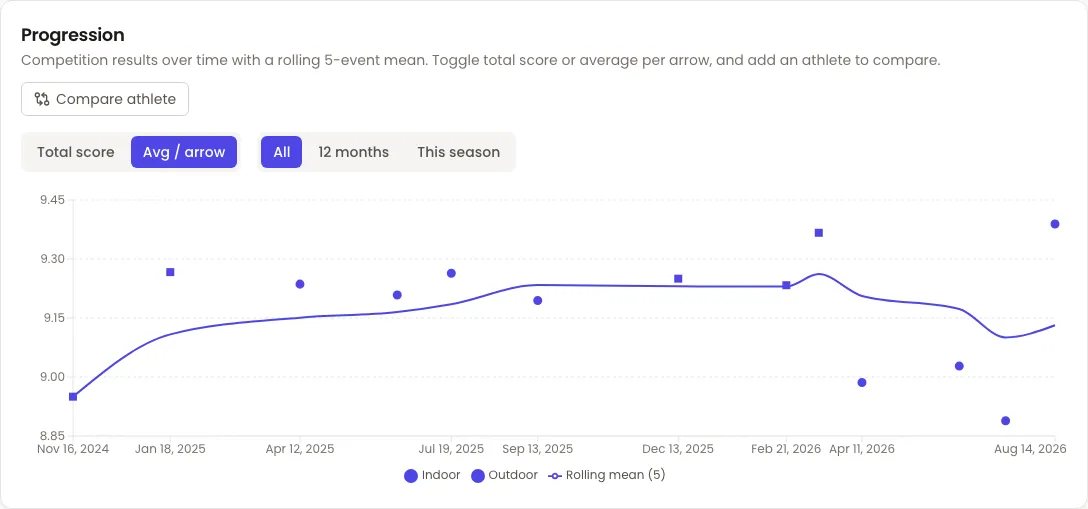
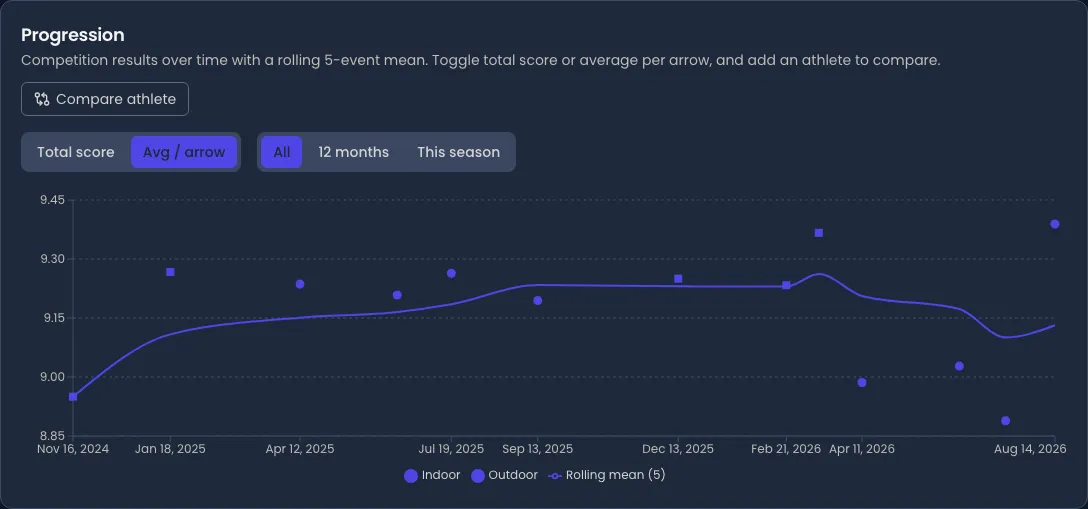
One marker per competition result, in date order.
- Total score and Avg / arrow switch what the vertical axis measures. Average per arrow is the comparable one: a 72-arrow round and a 60-arrow round have different totals and the same average.
- All, 12 months and This season set how far back the chart goes.
- Rolling mean (5) is the line through the markers — the mean of the last five events. Five results are what turn a good day and a bad day into a direction.
- Compare athlete overlays a second archer, with their own rolling mean, for a selection conversation or a squad-mate comparison.
Where Velos knows about them, changes in the athlete’s circumstances are marked on the chart — a change of bow level, or a transfer to another club — so a step in the line has its explanation next to it rather than in someone’s memory.
If the chart is empty, the athlete has no competition results inside the lens and the range you picked. Widen the range before assuming something is missing.
Consistency
Section titled “Consistency”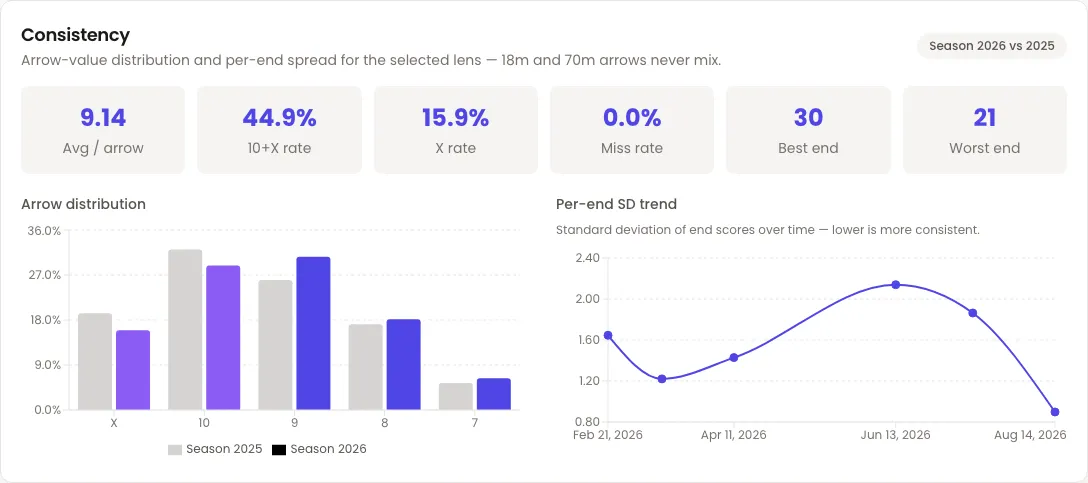
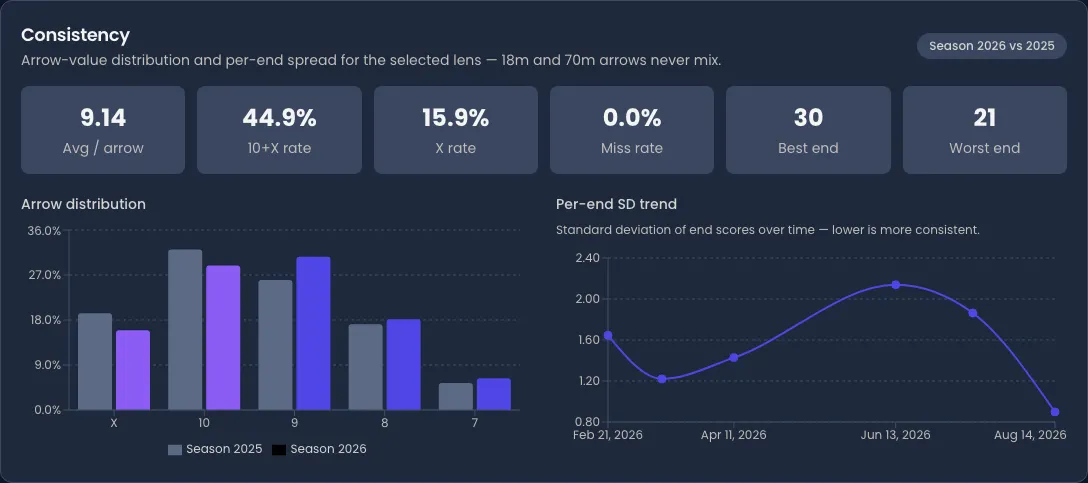
Progression says whether the scores are going up. Consistency says why.
- The six figures are the season in the current lens: Avg / arrow, 10+X rate, X rate, Miss rate, and the athlete’s Best end and Worst end.
- Arrow distribution is where the arrows actually went, this season against last. Two archers can average the same and have completely different shapes here, and the shape is what a coach can work on.
- Per-end SD trend is the spread of end scores over time — how far apart the ends of one round were. Lower is more consistent, and a line that falls while the average holds is an archer getting more reliable rather than more fortunate.
Not every round carries arrow-by-arrow detail. Where a season’s results were recorded as end totals only, the card says so instead of drawing a distribution from numbers it does not have.
Match play
Section titled “Match play”A third card, Match-craft, closes the tab: the athlete’s elimination record for the season — matches, win–loss, win percentage, shoot-offs, its set-scoring and cumulative-scoring figures, their most-faced opponents, and any team or mixed team matches they shot. The same figures are compared across a whole squad in Match-craft and reports.
Talent ID
Section titled “Talent ID”Performance → Talent turns the question round. Instead of an athlete you have chosen, it ranks every athlete against the ones most like them — same gender, same bow, same age band — and reports where each sits in that group and how fast they are moving.
The filter row is the lens plus the cohort: Discipline, Season, Gender, Bow type, Age band — U15, U18, U21, Senior or 50+ — and Able-bodied or Para. Four tiles above it count Athletes, Cohorts, Watchlisted and Low confidence.
The table carries, per athlete:
- Cohort — the group they are being measured against.
- Season best and Season avg — their own figures, as elsewhere in the suite.
- Cohort %ile — where they sit in that group.
- 12-mo slope — their improvement in points per year.
- Velocity — how fast they are moving through the cohort, which is the column the view exists for: an athlete at the 40th percentile climbing quickly is a more interesting selection question than one sitting still at the 80th.
- Comps (12m) — how many competitions the figures rest on.
- Watchlist — the flag that puts them on the cockpit’s watchlist and into the Watchlist squad.
Percentile curves plots season-best average against age, with the federation’s P10–P90 band behind it, so an athlete can be read against the spread rather than against a single number. The curve needs one gender and one bow type selected — a band drawn across mixed cohorts would mean nothing — and Compare athletes overlays named archers on top of it.
Two honest limits are worth knowing before this view is used for a decision.
Cohorts need dates of birth. Age band is what defines a cohort, so an athlete whose record has no date of birth cannot be placed in one and is left out. The view says how many were excluded. Where the roster has few dates of birth recorded, the cohorts come back empty — that is missing data, not a missing feature, and it is fixed on the athlete records themselves.
Small cohorts are marked, not hidden. Under twelve athletes in a cohort, Velos flags the figures as low confidence and counts them in the Low confidence tile. It still shows them, because a small federation would otherwise see nothing at all — but a percentile out of nine people is a description of nine people.
Match-craft and reports — what elimination results say about match play, and how to get any of this out of Velos.
Updated for v1.63.0