
Match-craft and reports
A qualification score says how well someone shoots. It does not say how they compete. Performance → Match-craft is built entirely from elimination results: who converts a good seeding into a good finish, who wins the end that decides a match, and who owns which rivalry.
Four tiles head the page — Athletes, Matches, Win rate and Shoot-offs — and count what the filters leave. The filter row is the same lens as the rest of the suite — Outdoor or Indoor — plus All squads, All bows, All genders and a Season, which here is a dropdown: match play is worth reading a season at a time.
Seed → finish conversion
Section titled “Seed → finish conversion”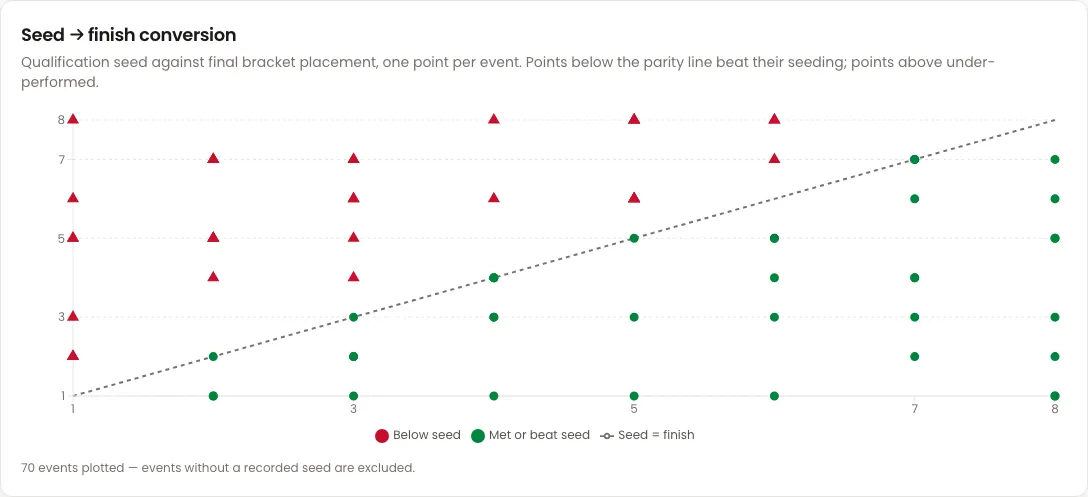
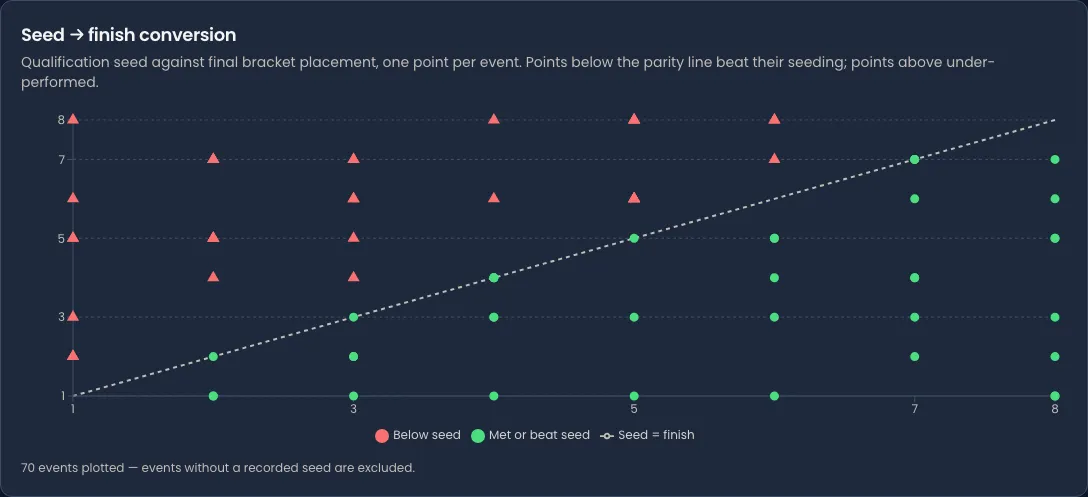
Each point is one athlete at one competition: where they qualified along the bottom, where they finished in the bracket up the side. The dashed line is parity — seed and finish the same.
- Green, on or below the line — they matched or beat their seeding.
- Red, above the line — they went out earlier than their qualification suggested.
Read as a cloud rather than as points. A squad sitting mostly below the line competes above its ranking round; one sitting mostly above it is qualifying better than it eliminates, which is a coaching problem rather than a shooting one.
Events without a recorded qualification seed cannot be placed on the horizontal axis and are left out; the count under the chart says how many were plotted.
The match KPIs
Section titled “The match KPIs”Below the chart, one row per athlete. On a full roster the table is long and its first rows are often archers who shot no eliminations at all, so it is worth narrowing to a squad first.
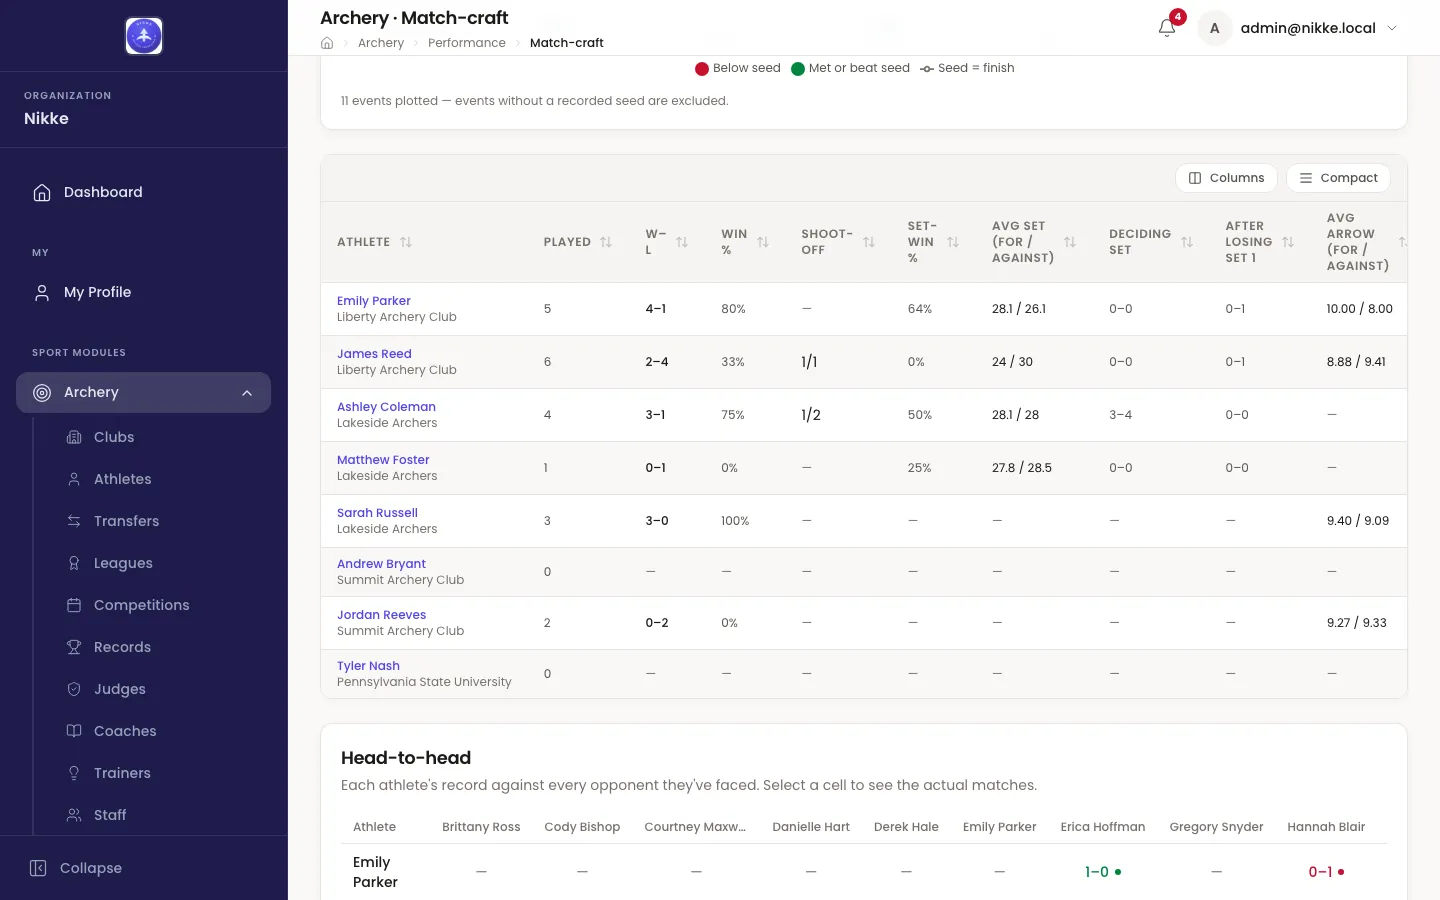
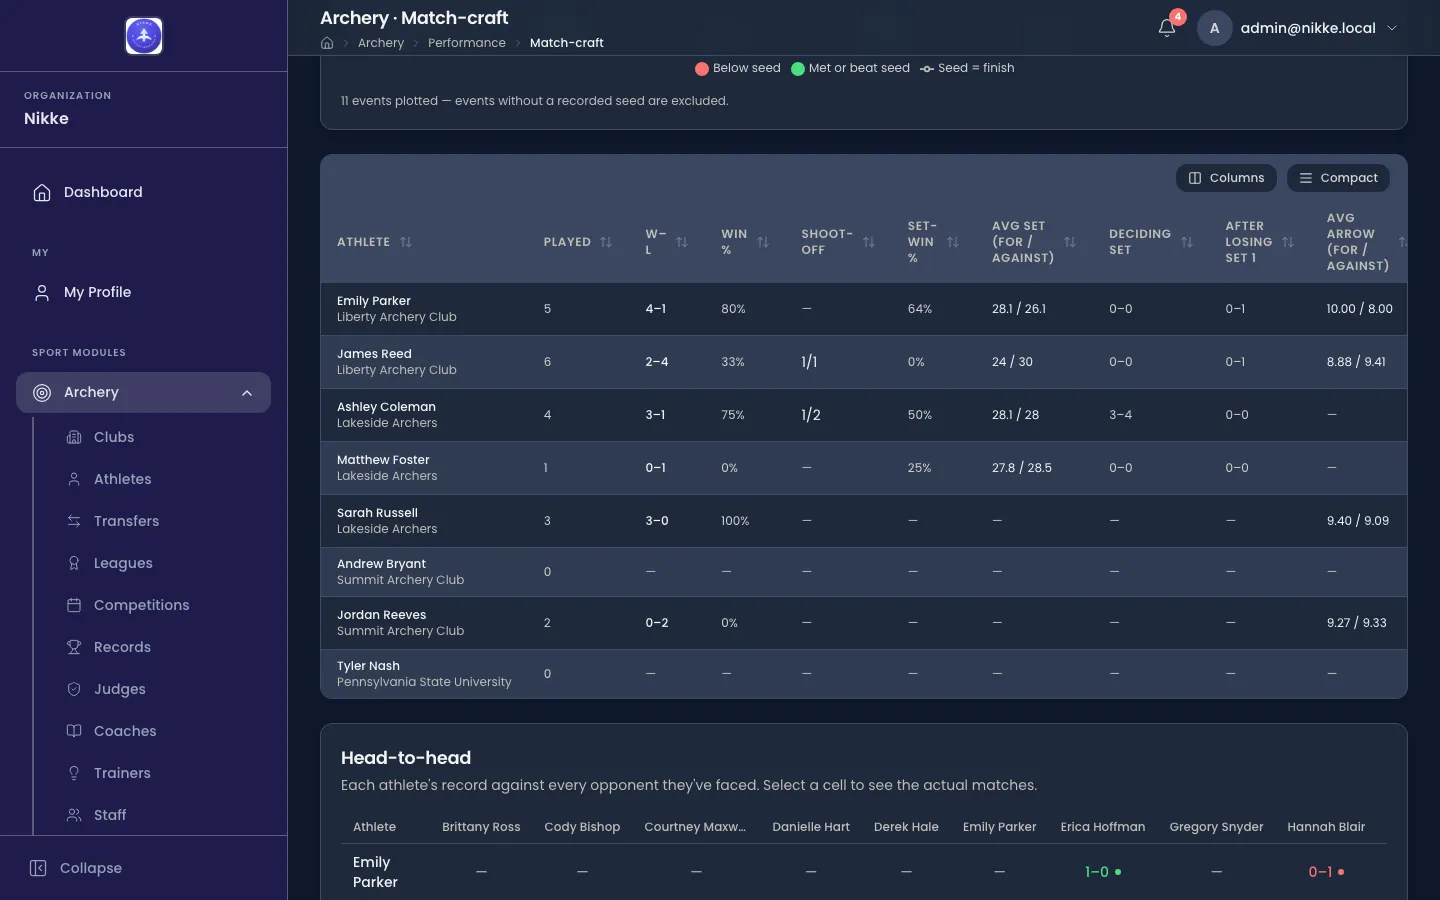
- Played, W–L and Win % — the plain record.
- Shoot-off — shoot-offs won out of shoot-offs shot. A separate column because the arrow that settles a tie is its own skill.
- Set-win %, Avg set (for / against), Deciding set and After losing set 1 — the set-scoring columns, so recurve and barebow matches. Deciding set and After losing set 1 are the two that describe temperament rather than form.
- Avg arrow (for / against) and Avg margin — the cumulative-scoring columns, so compound matches.
- Seed → finish — the same conversion as the chart, as a number: how many events, and the average seed against the average finish.
An athlete who shoots one form leaves the other form’s columns empty, and an athlete with no matches this season is a row of dashes. Neither is a fault.
Head-to-head
Section titled “Head-to-head”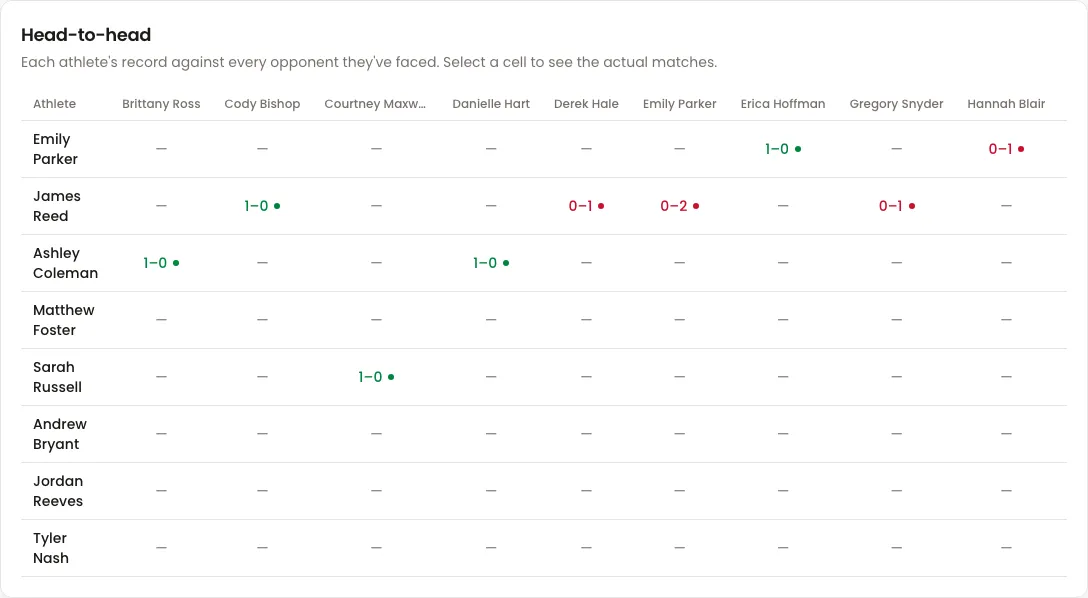
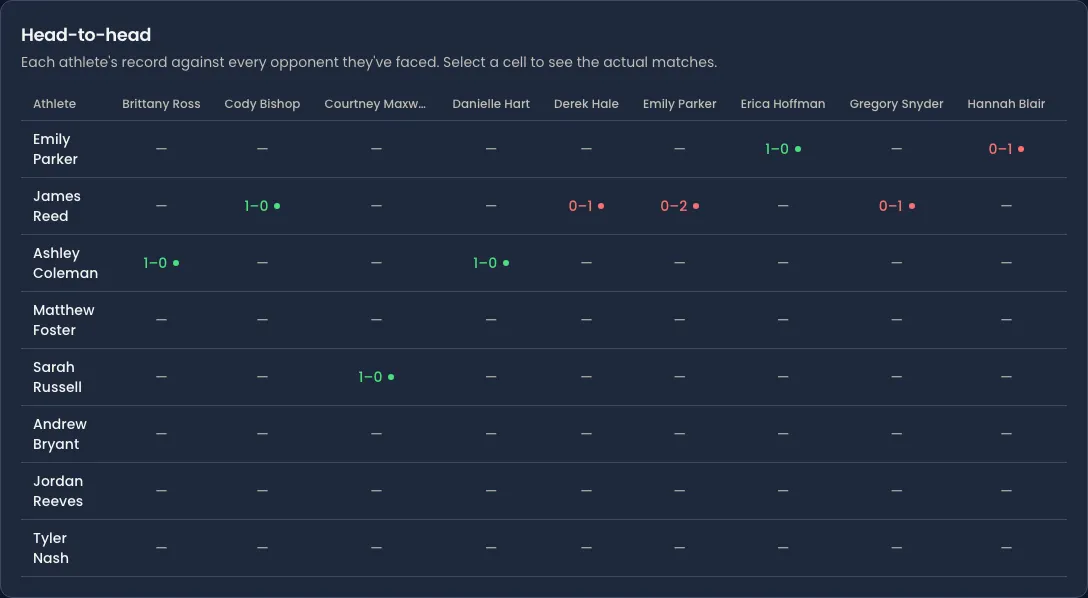
Each row is one of your athletes, each column an opponent, and the cell their record against that opponent. Selecting a cell opens the matches behind it, so a record can be checked rather than trusted.
Expect most of the grid to be empty. In a federation of any size, most pairs of archers have never met — the grid exists to find the few pairs that have, before a bracket puts them together again. Narrowing to a squad is what makes it readable.
Reports and exports
Section titled “Reports and exports”Some questions are not answered on a screen. Performance → Reports is where the numbers leave Velos.
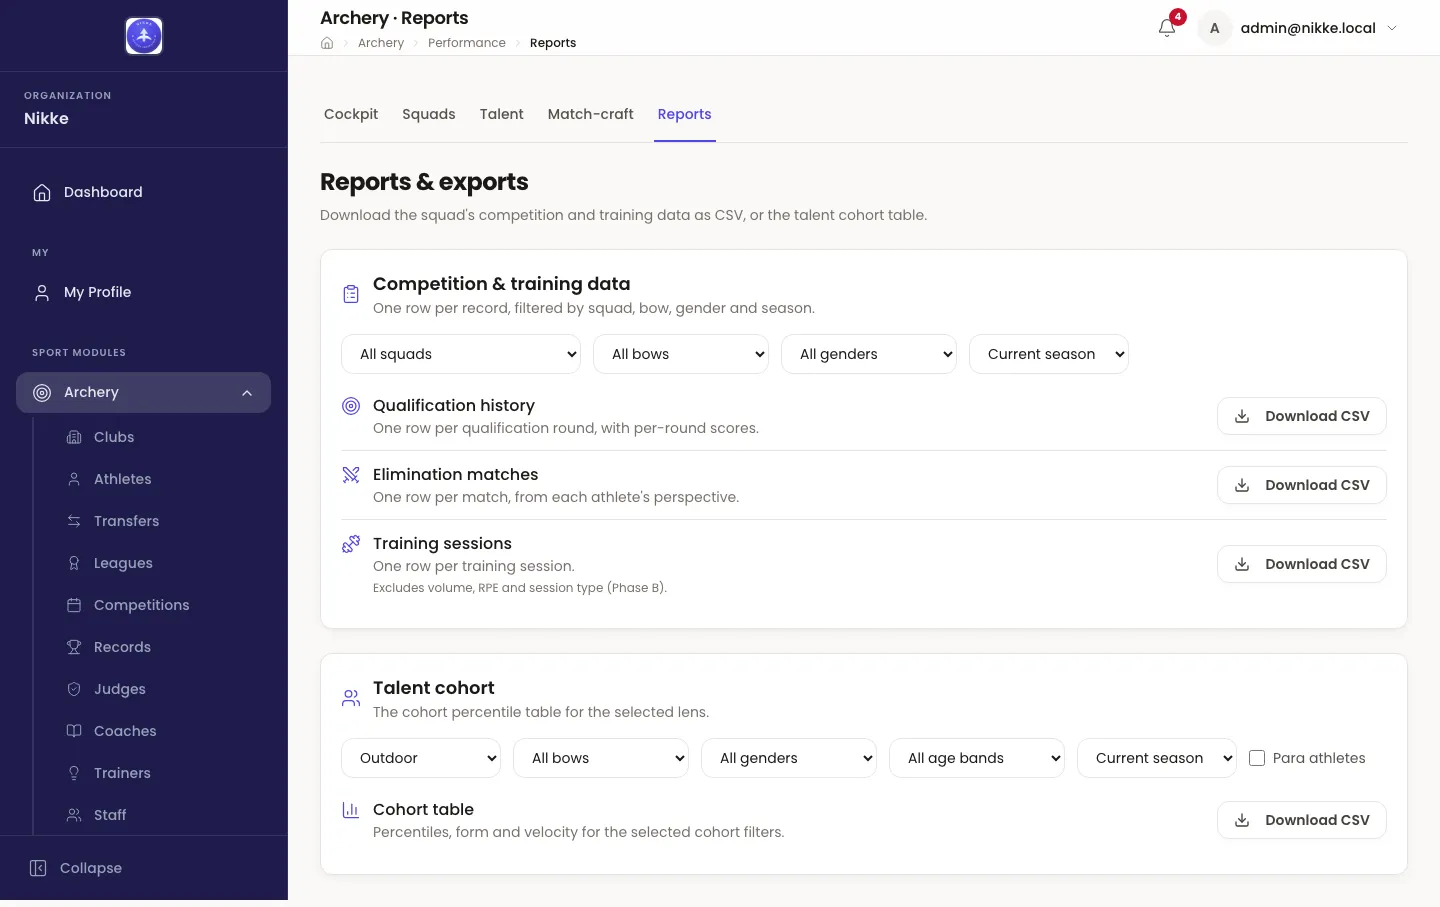
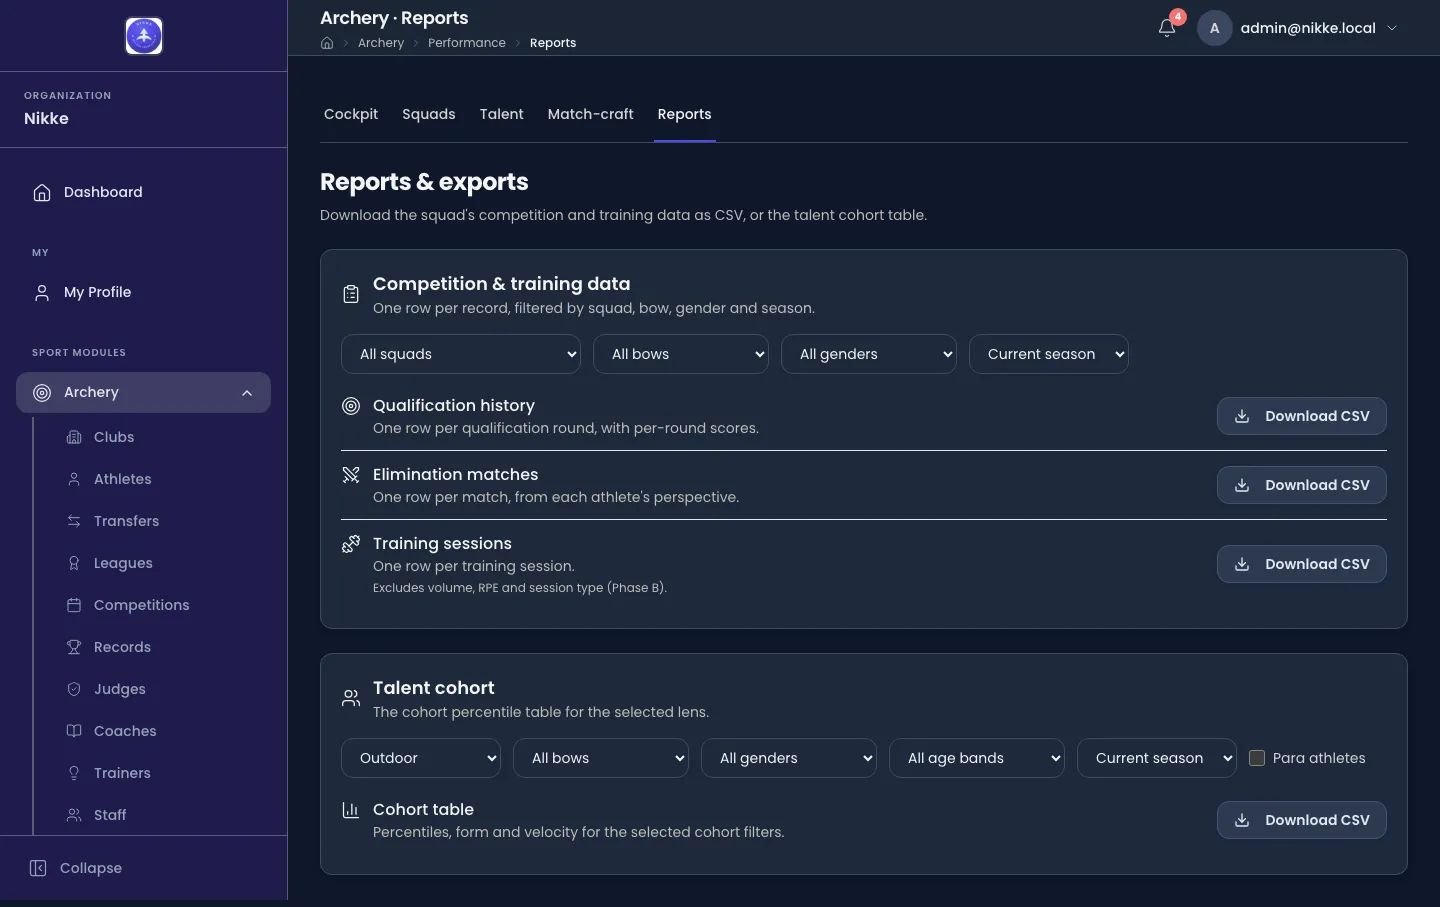
Competition & training data exports the athletes the filters leave — squad, bow, gender and season — in three shapes:
- Qualification history — one row per qualification round, with its per-round scores.
- Elimination matches — one row per match, written from each athlete’s point of view rather than the bracket’s.
- Training sessions — one row per training session.
Talent cohort exports the Talent ID table — percentiles, form and velocity — for the cohort its own filters describe.
Everything downloads as CSV, which opens in any spreadsheet. The three competition and training exports are also reachable straight from the cockpit’s Export button, already filtered to the board in front of you; this page is where you set the filters yourself.
That is the whole Performance section. Back to the overview for how the two layers fit together, or to Training for where much of the raw material is recorded in the first place.
Updated for v1.63.0